The cost of capital of a portfolio of outsourced services
The ideas in this post are based on the work of Chris Verhoeff, a professor at the Dutch Free University in Amsterdam. More of his work you can find here. I made some minor adjustments, but most of this post is based on his work. The reason I wrote this post is that I use his ideas in approaching sourcing decisions from a more strategic risk-return perspective (I’m now working into the direction of combining this approach with option pricing principles to get a more advanced financial approach). Even though only a very few will find this post usable, those one or two out there might help it in your search for knowledge.
The cost of capital of a portfolio with outsource contracts.
Some outsourcing contracts in the portfolio will be successful and add value and some of them will not. This needs to be accounted for when setting overall thresholds on potential returns. The threshold for each outsource agreement needs to be at least the Weighted Average Cost of Capital (WACC), plus the average risks of the outsource contracts. These risks can be averaged over the entire portfolio, and this premium could be called the Weighted Average Cost of the Outsourced Portfolio (WACOP). Within companies it is often known what the WACC comprises. However, it is often not known how large the cost of capital of the outsourced service portfolio is.
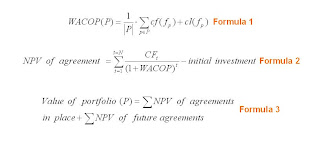
For this reason the WACC is used in most cases to based outsource decisions on. As the risk profile of the typical outsourcing arrangement is substantial higher than the risk profile for the company as a whole, a too positive picture is created. As in practise outsource portfolio are rather small, the WACOP has to be estimated. This is depicted in formula 1.
In this equation represents the outsourced service portfolio P and ׀P׀ the number of agreements in the portfolio. The small p represents the relevant information of the agreement and would include among others the date the initiative to outsource starts, date the agreement becomes effective and the delivery and transaction costs. The fp represents the service activity based on the information represented by p.
The chance of the outsourcing totally failing is represented by cf, and the chance of a partial failure is denoted cl. The calculations of cf and cl are based on benchmark information, but not further discussed here as it would deviate too far from the aim of this post (= providing a high level overview, more detail here).
Formula 2 uses the WACOP from formula 1 as the discount rate to calculate the Net Present Value (NPV) of an agreement within the portfolio. The N in the formula represents the duration of the agreement while CFt stands for the cash flow in period t. The initial investment captures funds required for the transfer and transformation, design and implementation of the retained organisation and the outsource project itself.
The value of the portfolio as a whole can now be written in terms of the net present values of all the current individual agreements plus the projected net present values of the planned future outsourcing initiatives (formula 3).
Out of both formula’s can among others be derived that by terminating an existing agreement that has a negative present value based on the anticipated future cash flow, the value of the portfolio will increase with that amount (minus the impact of the exit and re-stransition investments).
The last remark regarding the calculation of value is that the first formula assumes that the WACOP is a constant and does not change over time. This will in real life however not be the case as the risk profile of the portfolio will change over time. This means that various discount rates have to be used in order to approach the real value of the portfolio.

Comments
Post a Comment